 |
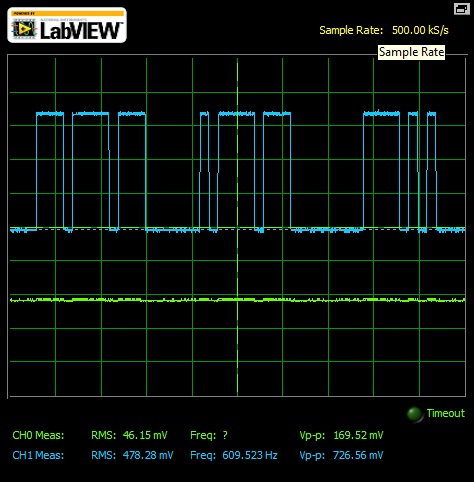
The Fig.1 shows the PCM Encoding of a 0 V Ground but sampled that signal at an intervals desired by a clock signal of 10 kHz given in the PCM Block. The frequency observed is 609.523 Hz.
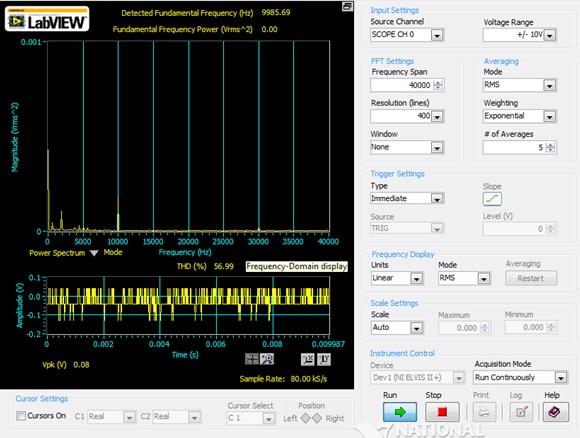 |
The fundamental frequency component is at frequency of 9985.69 Hz. The THD is 56.99% & Signal to noise ratio is 0.33 dB.
 |
The THD is 145.87% & the SINAD is 0.81 dB. The fundamental frequency present is 609.70 Hz & the Fundamental Power is 0.14.
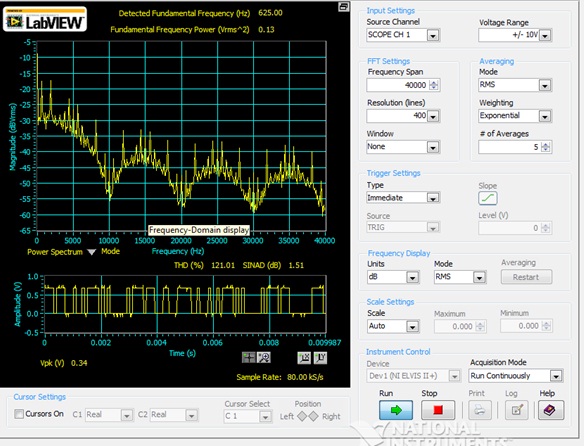 |
The THD is 121.01% & SINAD is 1.51 dB. The fundamental frequency present is at 625 Hz & the fundamental power is 0.13 .
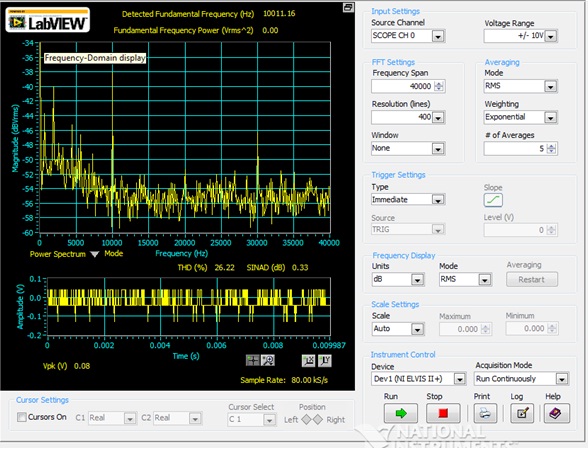 |
The THD is 26.22% & SINAD is 0.33 dB. The fundamental frequency present is 10011.16 Hz.